 MineArchive
Three thousand mines, and what the map has taught us
16 October 2026
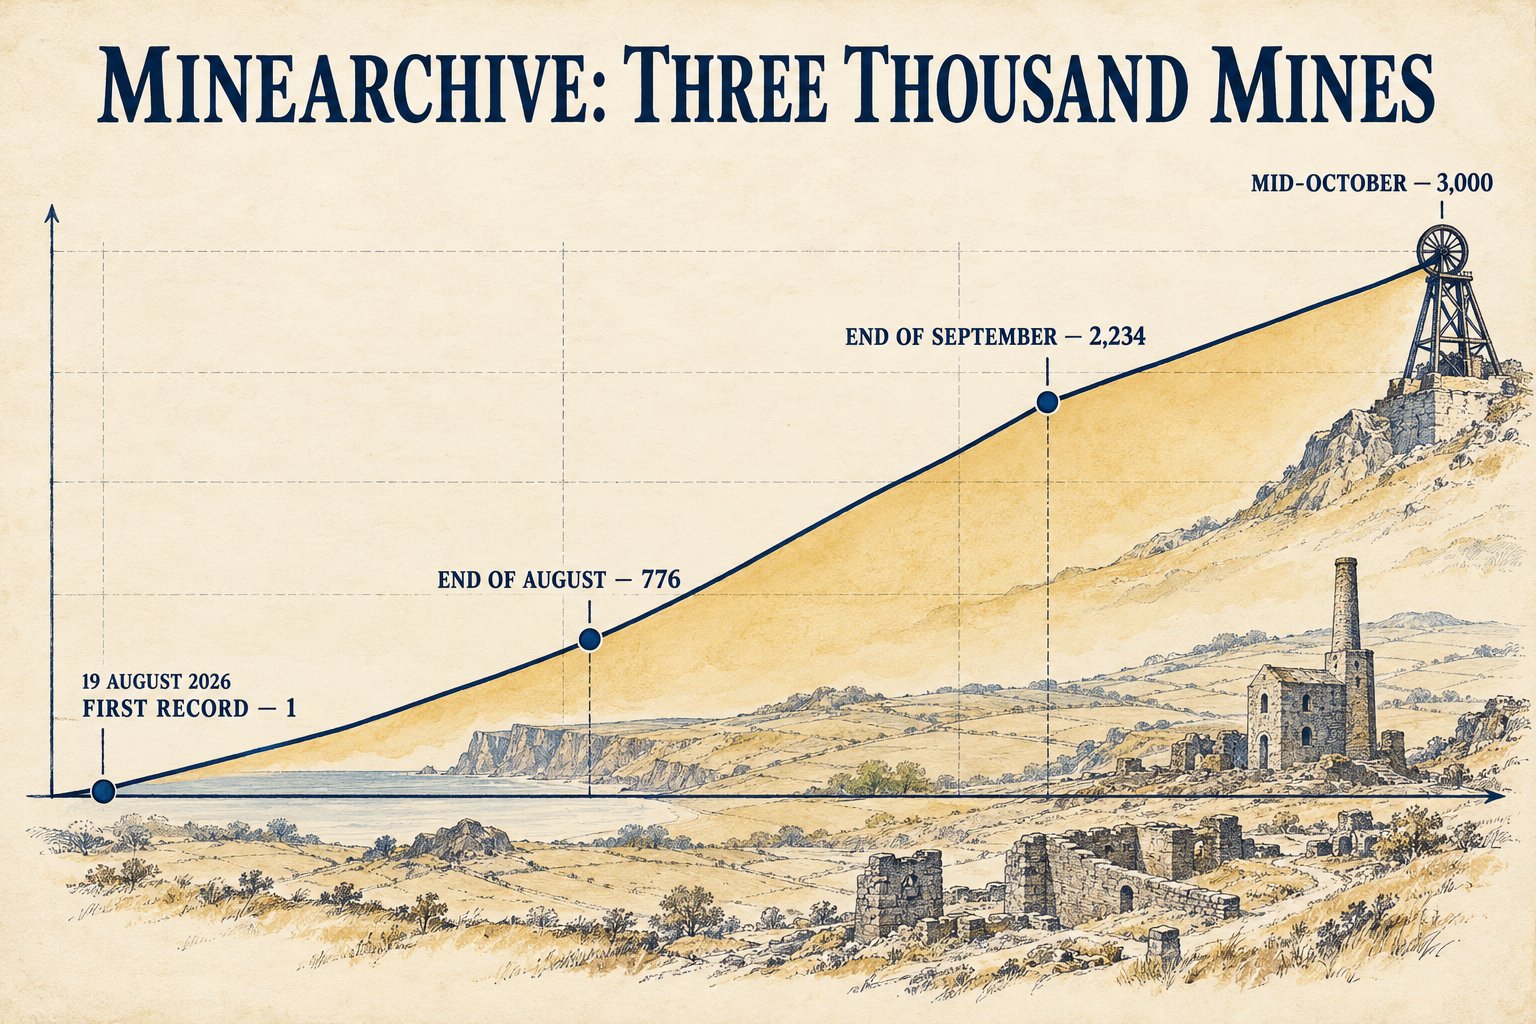
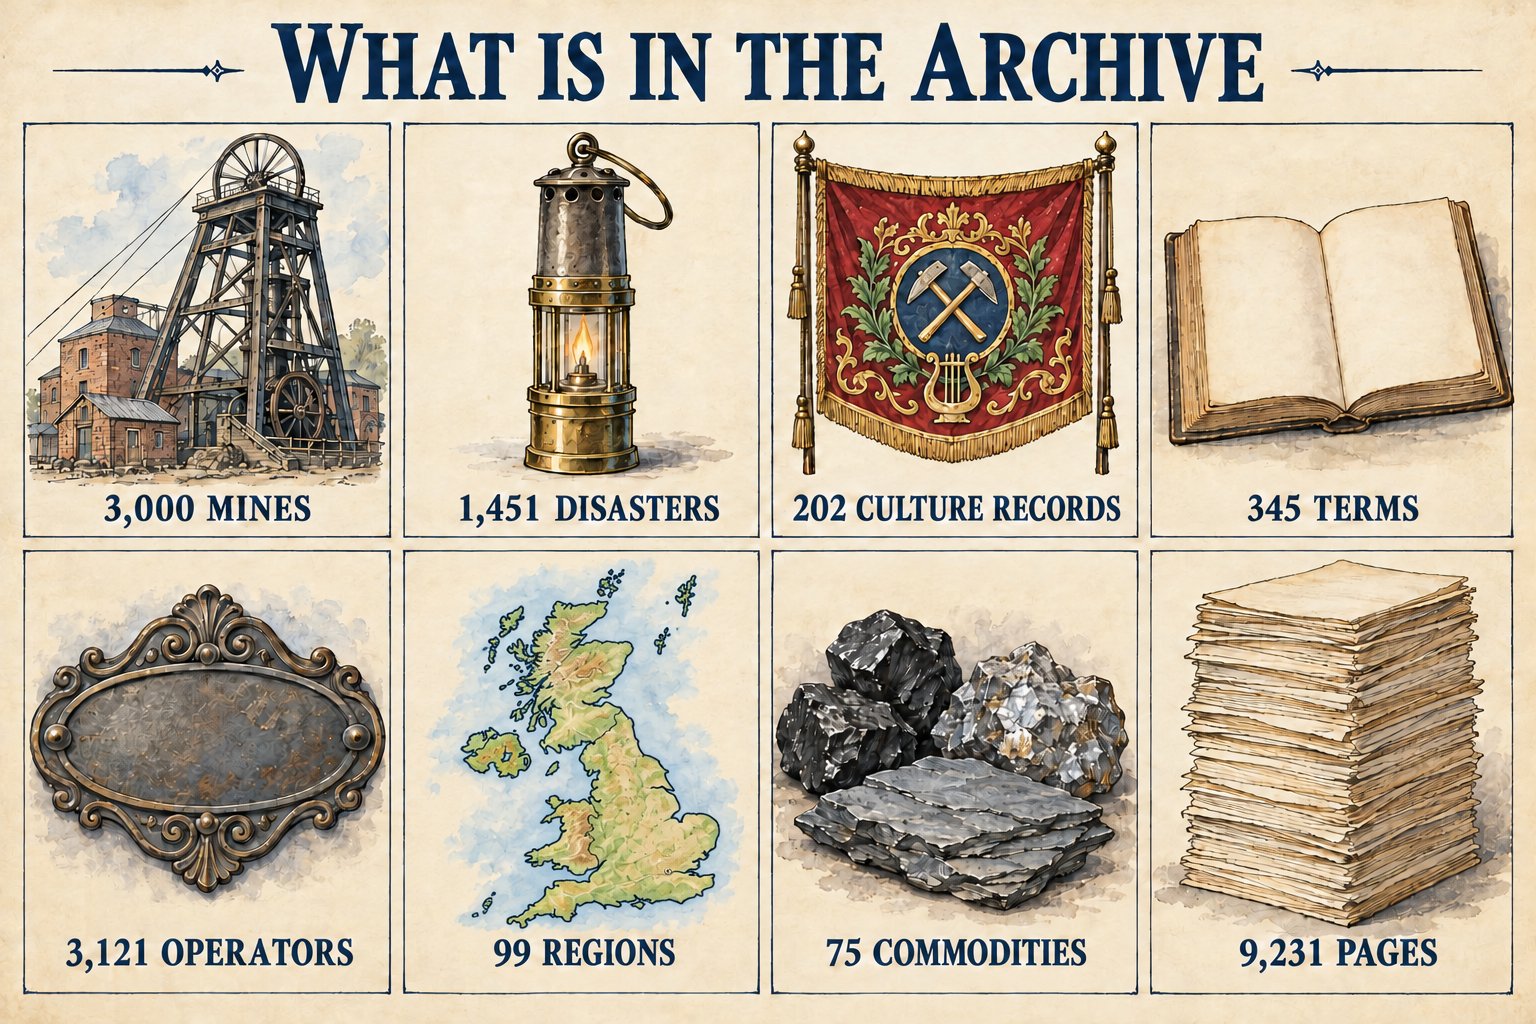
MineArchive has passed 3,000 mines. The first record went up on 19 August 2026; two months later the archive holds more than three thousand mine records across 100 regions and 75 commodities, 1,452 disaster records, 202 culture records, 345 terms and the pages of 3,127 operators, built into 9,252 pages. This article takes stock of how the site has grown, what readers have told us, and where it is going next. Two things stand out from the mail. The map has been by far the most useful feature to the people who write in, and we have kept improving it: year sliders, a switch between working mines and disasters, filters by commodity and disaster type, and the full map on every region page. It is also the feature where our limits show most plainly, because a pin is only as good as the grid reference behind it, and we say so below. The other is that the emails themselves, corrections and pointers and the occasional note that the site helped with a piece of family history, have improved the archive directly and are the best reason there is to keep going. The season is turning, so the Halloween decorations are going on site-wide; they can be switched off in a click. And a word on advertising: the About page has always said the site may carry a little of it, enough to pay for itself and perhaps a curry a month, and this article explains why we have held off.
What changed
The archive passed 3,000 mine records this week. The three-thousandth is Sark's Hope Silver Mine at Port Gorey on Little Sark, the only metal mine in the Channel Islands ever to ship ore and the venture whose debts cost the Le Pelley family the fief of Sark; it brings a new region, Sark, and with it the Channel Islands, into the archive. It started on 19 August 2026 with a handful of Cornish tin mines and Welsh slate quarries; by the end of August there were 776 published mines, September added 1,458, and October has added 766 so far. Each record is researched from at least two sources on two different websites, carries a history of at least eighty words, three or more sourced claims and a position or an honest Unknown, and is published only when it meets that floor.
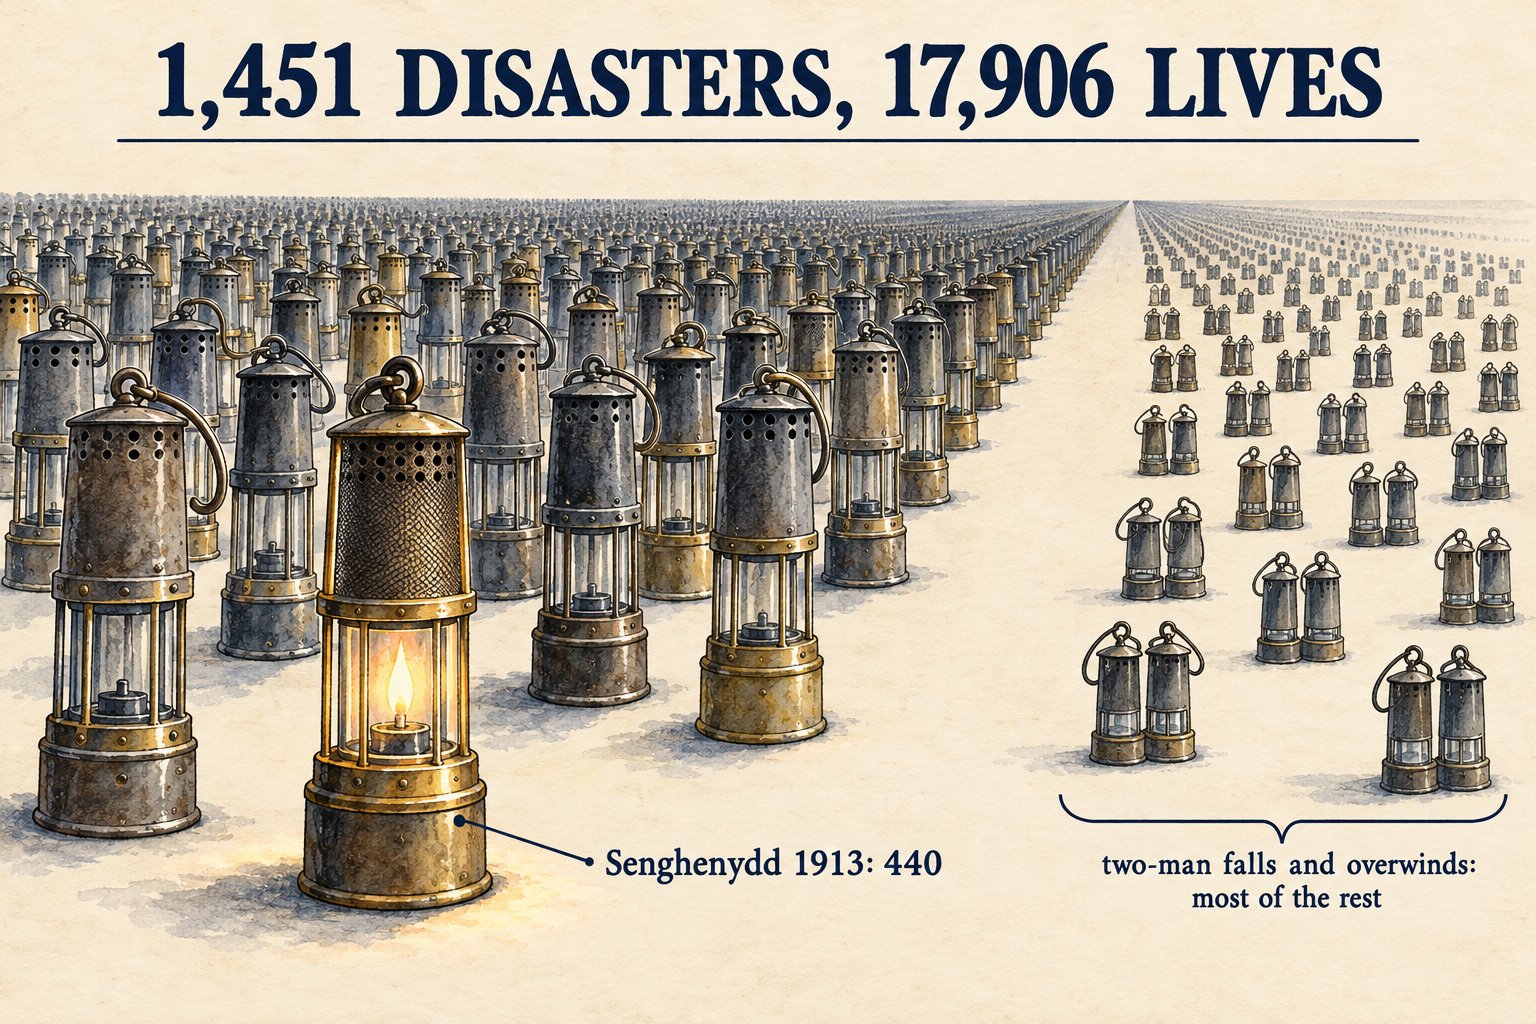
The mines are the spine, but not the whole body. The archive now holds 1,452 disaster records, which between them record 17,916 deaths, from the 440 at Senghenydd in 1913 to the two-man falls and overwinds that never made a national newspaper. There are 202 culture records, the songs, football clubs, banners, films and novels that grew out of pit communities; 345 terms explaining the trade's vocabulary; 18 geology records; 3,127 operator pages for the companies, partnerships and individuals that owned or ran the mines; 99 region pages; 75 commodities; and 111 fictional mines, commodities and disasters from books, games and film. Behind the pages sit 13,845 sources and 24,037 individually sourced claims, 2,479 images, and 19,184 links from records to the terms they use. The oldest working on file is the Frosterley marble quarry, cut since at least 1183.
All of that builds into 9,252 pages, every one of them a plain static page with no database behind it, which is why the site stays fast.
From this week the Halloween decorations are on for everyone: a garland in the header, a pumpkin cart in the corner, a zombie keeping an eye on the Nearby mines, a ghost on the Terms page and a witch on About. They are pictures and a little script and nothing more; no page loads slower and nothing is tracked.
Why
The site exists to be useful, and the proof of that has come in the post rather than in the statistics. Readers have written with corrections, with pointers to sources we had not found, with mines we had missed, and sometimes simply to say that a record answered a question they had carried for years. Several of those emails turned straight into changes on the site. Numbers on a dashboard say that people are visiting; a note from someone who found what they were looking for says that the work is worth doing. If you have something to add, please write. Nobody is named here, but every one of those messages was read and acted on.
On advertising: the About page says that MineArchive is meant to be a useful resource first, to pay for itself second, and perhaps to buy its keeper a curry once a month third, in that order, and that any advertising should never matter more than the material it sits beside. We have been slow to switch it on, and that is deliberate. The first job is to get the core of the site right: accurate records, a map people can trust, pages that load quickly on a phone in a car park outside a quarry. Only once it is genuinely useful does it make sense to ask it to pay for itself, and even then the advertising will be small. That order has not changed.
How to use it
The map is at Map in the menu, and every region page now carries the full map of that region. The Show control switches between mines operating and mining disasters. The year sliders narrow either view to a span of years, so you can see what was working in 1850, or every explosion between 1860 and 1880. The commodity filter picks out tin, slate, lead or whatever you are after, and the disaster view has a filter by type. Each pin links through to its record, and each mine page has a Show on the map link and a list of the nearest mines within nine miles. Open a region page and the map arrives already framed on that region, with the same controls; open the full map from there and the region is kept until you reset it.
The commodity filter works on the whole country as well as on a region. Pick tin and the pins thin to Cornwall and west Devon; pick lead and the Pennine dales and mid Wales fill in; pick slate and the map draws Snowdonia and the Lake District for you. We know of no other free resource that plots Britain's mines by commodity in that way.
To turn the Halloween decorations off, open the settings cog at the right-hand end of the menu and switch off Halloween decorations. The choice is remembered in your browser and nothing else changes. The accessibility options, for contrast, link underlining, motion and reading width, are at the foot of every page, and the same cog has a row that opens them.
If there is a map feature that would help you, a layer, a filter, an export, a way of sharing a view, tell us. The map has been the most useful thing we have built, and the next improvements to it should come from the people using it.
Under the bonnet
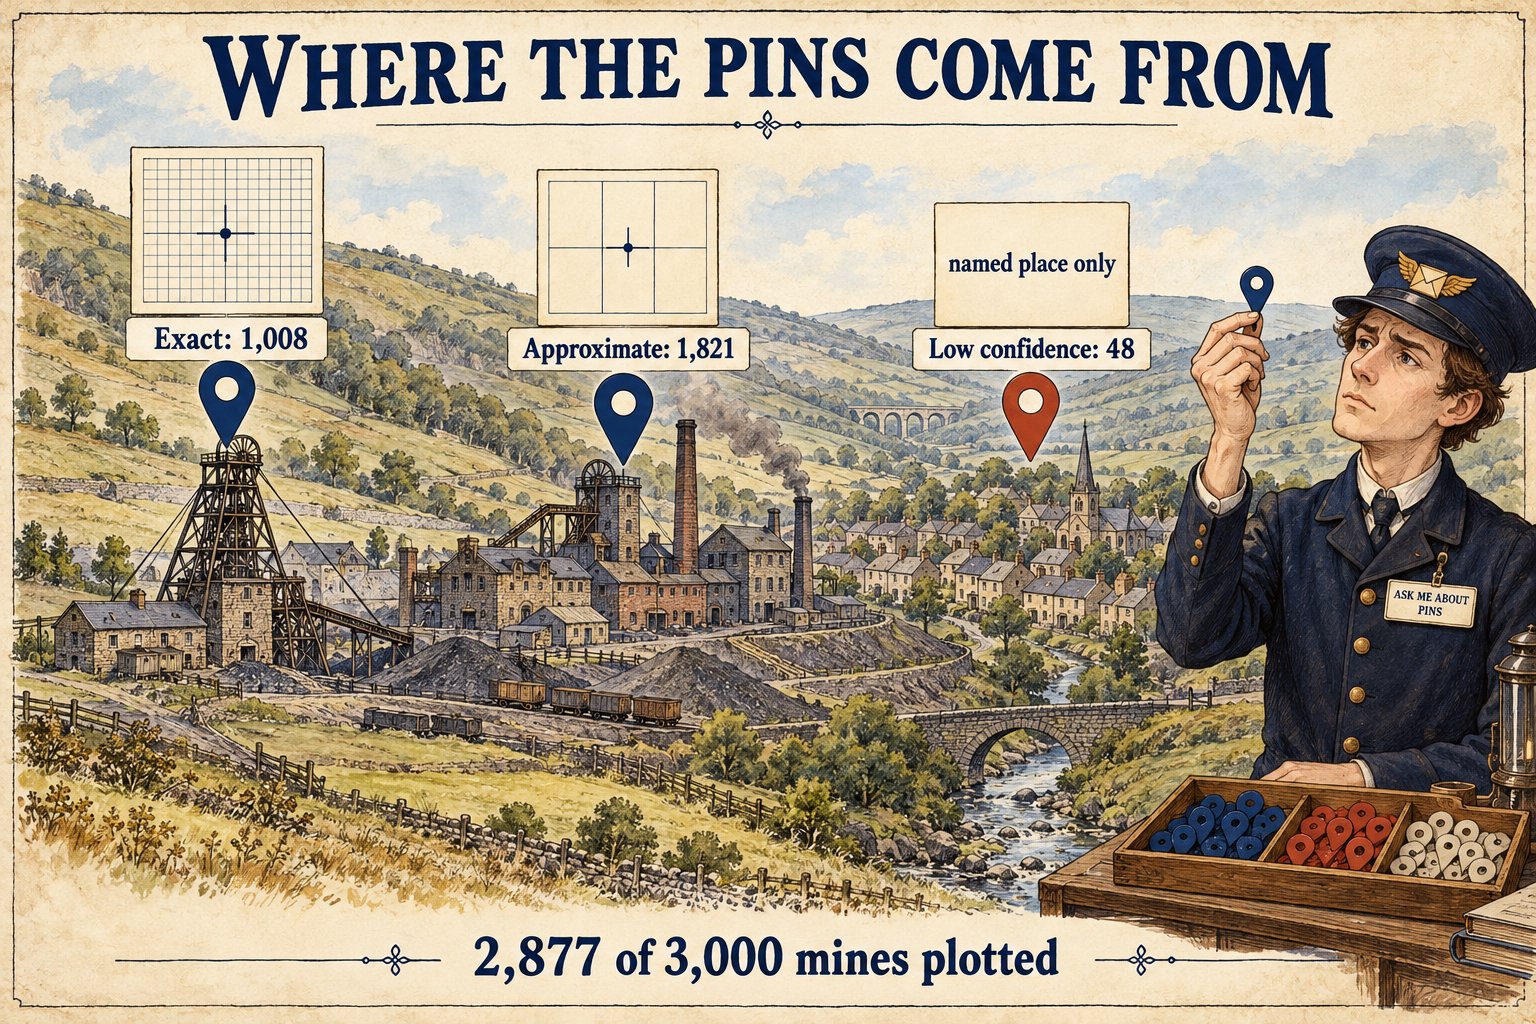
The hard part of the map is not drawing it but knowing where to put the pins. Of the 3,000 mines, 2,881 are plotted. For 1,009 of them the position is exact, taken from a grid reference or coordinates in a source that was read: a Canmore or Coflein record, a Historic Environment Record entry, a Wikipedia article, an abandonment plan. For 1,824 it is approximate, which usually means a six-figure grid reference, good to about a hundred yards, or a reference that places the colliery rather than its shaft. For 48 it is low confidence, a best estimate from the village or valley the sources name, and those pins are drawn in a different colour on the map with a note in the popup.
The disasters are on the map as well. A disaster takes its pin from the mine it belongs to, so 1,385 of the 1,452 disaster records can be placed; the rest belong to mines that are not yet plotted, and they will appear as those positions are found.
We should be plain about this: some positions have been wrong. Early records were plotted from the nearest named place, which can be miles from the pit, and a few reused a point that belonged to a neighbouring colliery. A good deal of October has gone into checking positions against published grid references. Every position now records the source it was read from, so a doubtful pin can be traced back and challenged, and the audit that runs with every build lists pins that sit far from the rest of their region or on top of another record. The information is only as good as the sources can provide, and for a small nineteenth-century pit the best any source offers is often the name of a farm.
The rest is simple by design. The archive is a single database of records, sources and claims, rendered into static pages on every build, with the map data written out as two small files that the page reads once. Adding a year slider or a disaster layer meant adding fields to those files and a few lines of script, not a server.
Tell us what you think
The map features we add next should be the ones you ask for. And if a pin is in the wrong place, the quickest fix is an email with the record's name and, if you have it, where it should be.
Happy Halloween, All Hallows' Eve or Samhain, whichever you keep.
Every change here is made for readers, and the best way to find out whether it works is to hear from them. If this one helps, gets in the way, or gave you an idea for something better, write to . Short notes are as welcome as long ones.