 MineArchive
Region maps now filter by year and show disasters
10 October 2026
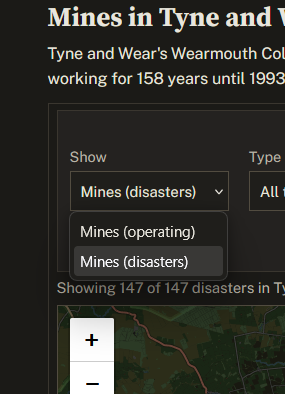
Every region page on MineArchive carries a map of the mines in that county or district. Until this week it was a fixed picture: every mine we have plotted, all at once, with a link to the full map if you wanted to do anything more. The region map now has the same controls as the full map. A Show select switches it between mines and the disasters recorded at them, a commodity or incident-type filter narrows it, and two year sliders let you ask which mines were working at a given date, or which disasters fell within a span of years. The count line above the map says what you are looking at in words, so a slider position is never left to be guessed at. Along the way we found the map measuring its own frame before the page had finished laying it out, and a private curator panel quietly loading inside the frame and stealing a third of its height. Both are fixed, and the map is a good deal taller.
What changed
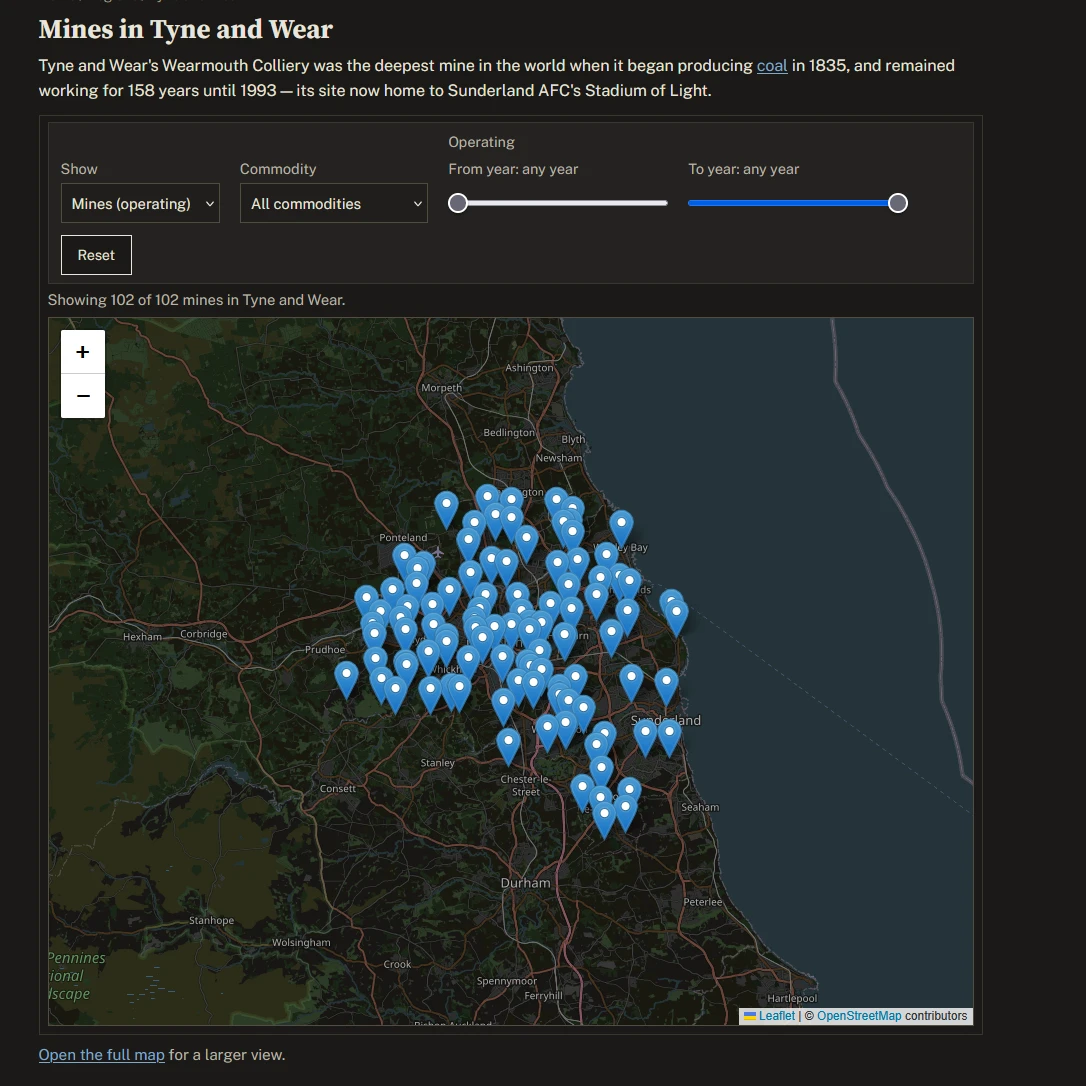
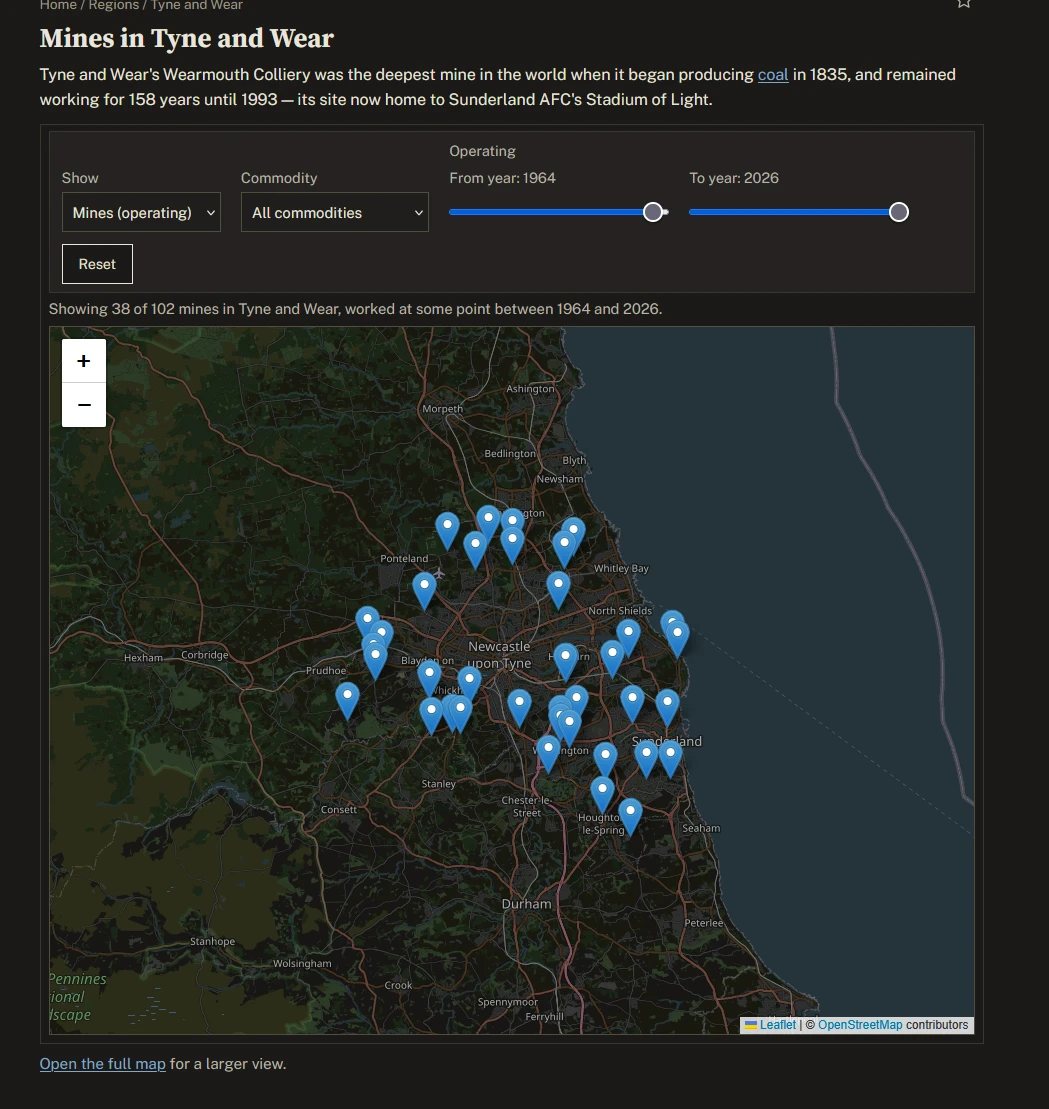
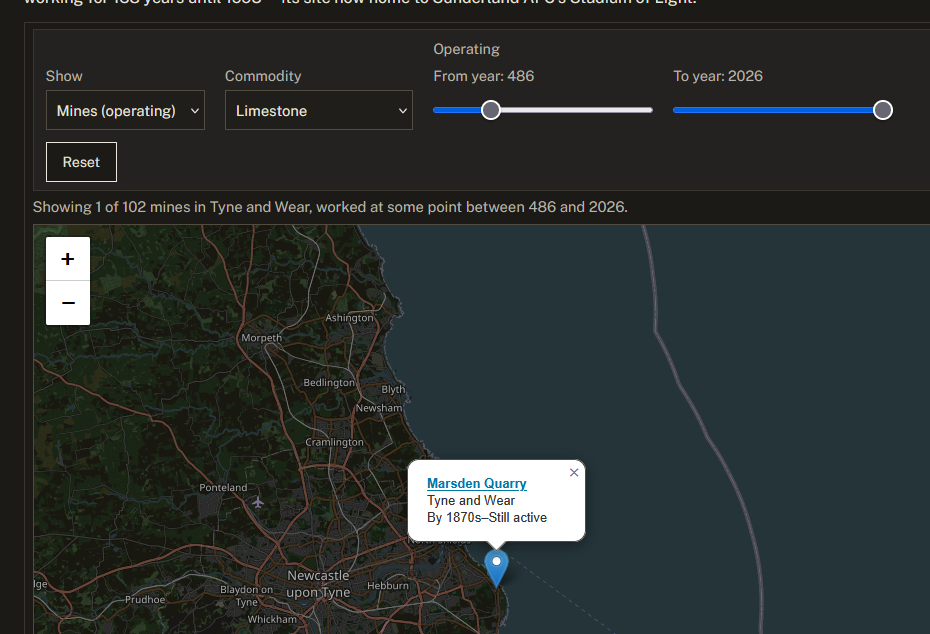
The map on each region page now carries the full map's filter bar. Show switches between mines and disasters; beside it a commodity filter (or, for disasters, an incident-type filter), then From year and To year sliders, and a Reset button. A line above the map reports what is shown: "Showing 38 of 102 mines in Tyne and Wear, worked at some point between 1964 and 2026", or "Showing 85 of 147 disasters in Tyne and Wear, that happened between 1708 and 1850". The frame is taller than before, and the "Open the full map" link beneath it is now just for a larger view rather than the only way to reach the filters.
Why
A region page is where most readers arrive with a question about a place: what was being worked here in 1900, or where the explosions were. The full map could answer that, but only after a click away from the page and a re-selection of the region. Putting the controls where the question is asked removes that detour. Disasters had never been shown on a region map at all, which was an odd gap for an archive that records them so carefully.
How to use it
Pick a region from the Regions index or a mine's breadcrumb. Leave Show on mines and drag the two year sliders together to see what was open in one year, or apart for a span; a mine counts if its working life overlaps the range at all. Switch Show to disasters to see the incidents at that region's mines, filter them by type, and use the sliders to narrow them to the years that happened within the range. Click any marker for the record's name, dates and a link to its page. Reset clears the filters but keeps you on the region.
Under the bonnet
The region map is the full map page loaded inside a frame, with a parameter that strips the site's header and footer. The first version of that parameter stripped the filter bar too, so the simplest route was a second level of the same parameter that keeps the controls and drops only the chrome. The map then had to learn two things it did not know before. Disasters are not stored with a region of their own: a disaster belongs to whichever regions its mines are in, so the build now writes those region slugs into the disasters data file and the map filters on them. And the "of 102" in the count line used to be the whole archive's total, which made no sense on a region page; it is now the region's own count.
Two bugs turned up in testing. The map's library, Leaflet, measures its container when it starts, and inside the frame that container only gets its final height once the page's layout has settled, so the first fit-to-region landed at the scale of the whole country; the map now re-measures itself before its first fit and on every resize. The second was more embarrassing: the site's private curator tools, which load on every page for signed-in editors, were loading inside the frame as well and rendering a review panel under the map. Embedded maps now never load them.
Tell us what you think
If you find a region whose map fits badly, a year where the count looks wrong, or a filter you wish the map had, say so.
Every change here is made for readers, and the best way to find out whether it works is to hear from them. If this one helps, gets in the way, or gave you an idea for something better, write to . Short notes are as welcome as long ones.